Making a map
A friend recently got a Glowforge 3D Laser Printer and I offered to help him break it in. One of the examples from Glowforge is a really beautiful bathymetric map. We thought it would be fun to do something similar, but to include topographic data (elevation above sea level) in addition to the bathymetric data, to make a full relief map. After searching around a bit, we found this NOAA site that provides a wealth of relief data in the form of tiff images.
We decided to focus on the San Francisco Bay Area. The raw elevation above sea level is encoded in meters as pixel values, where negative indicates that pixel is under water. This is what the raw data look like rendered as a heatmap using the reviled jet color map: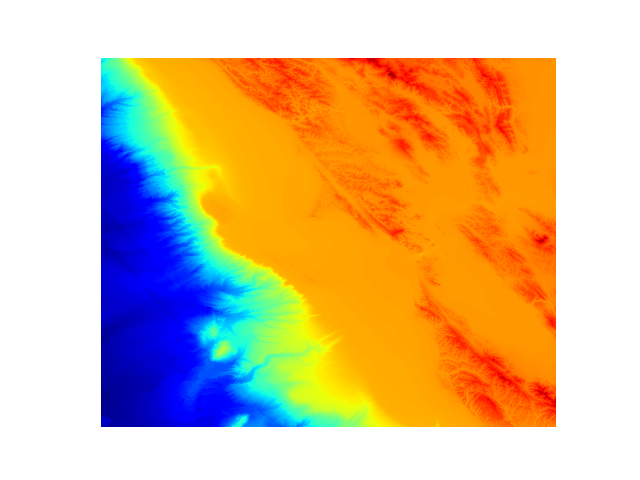 Turning this raw file into a vector image that the Glowforge could print turned out to be trivial using a handful of Python modules:
- tifffile to read the raw data
- scipy to resize the image
- matplotlib to draw the contours and save them to an svg file
- numpy for a few simple manipulations
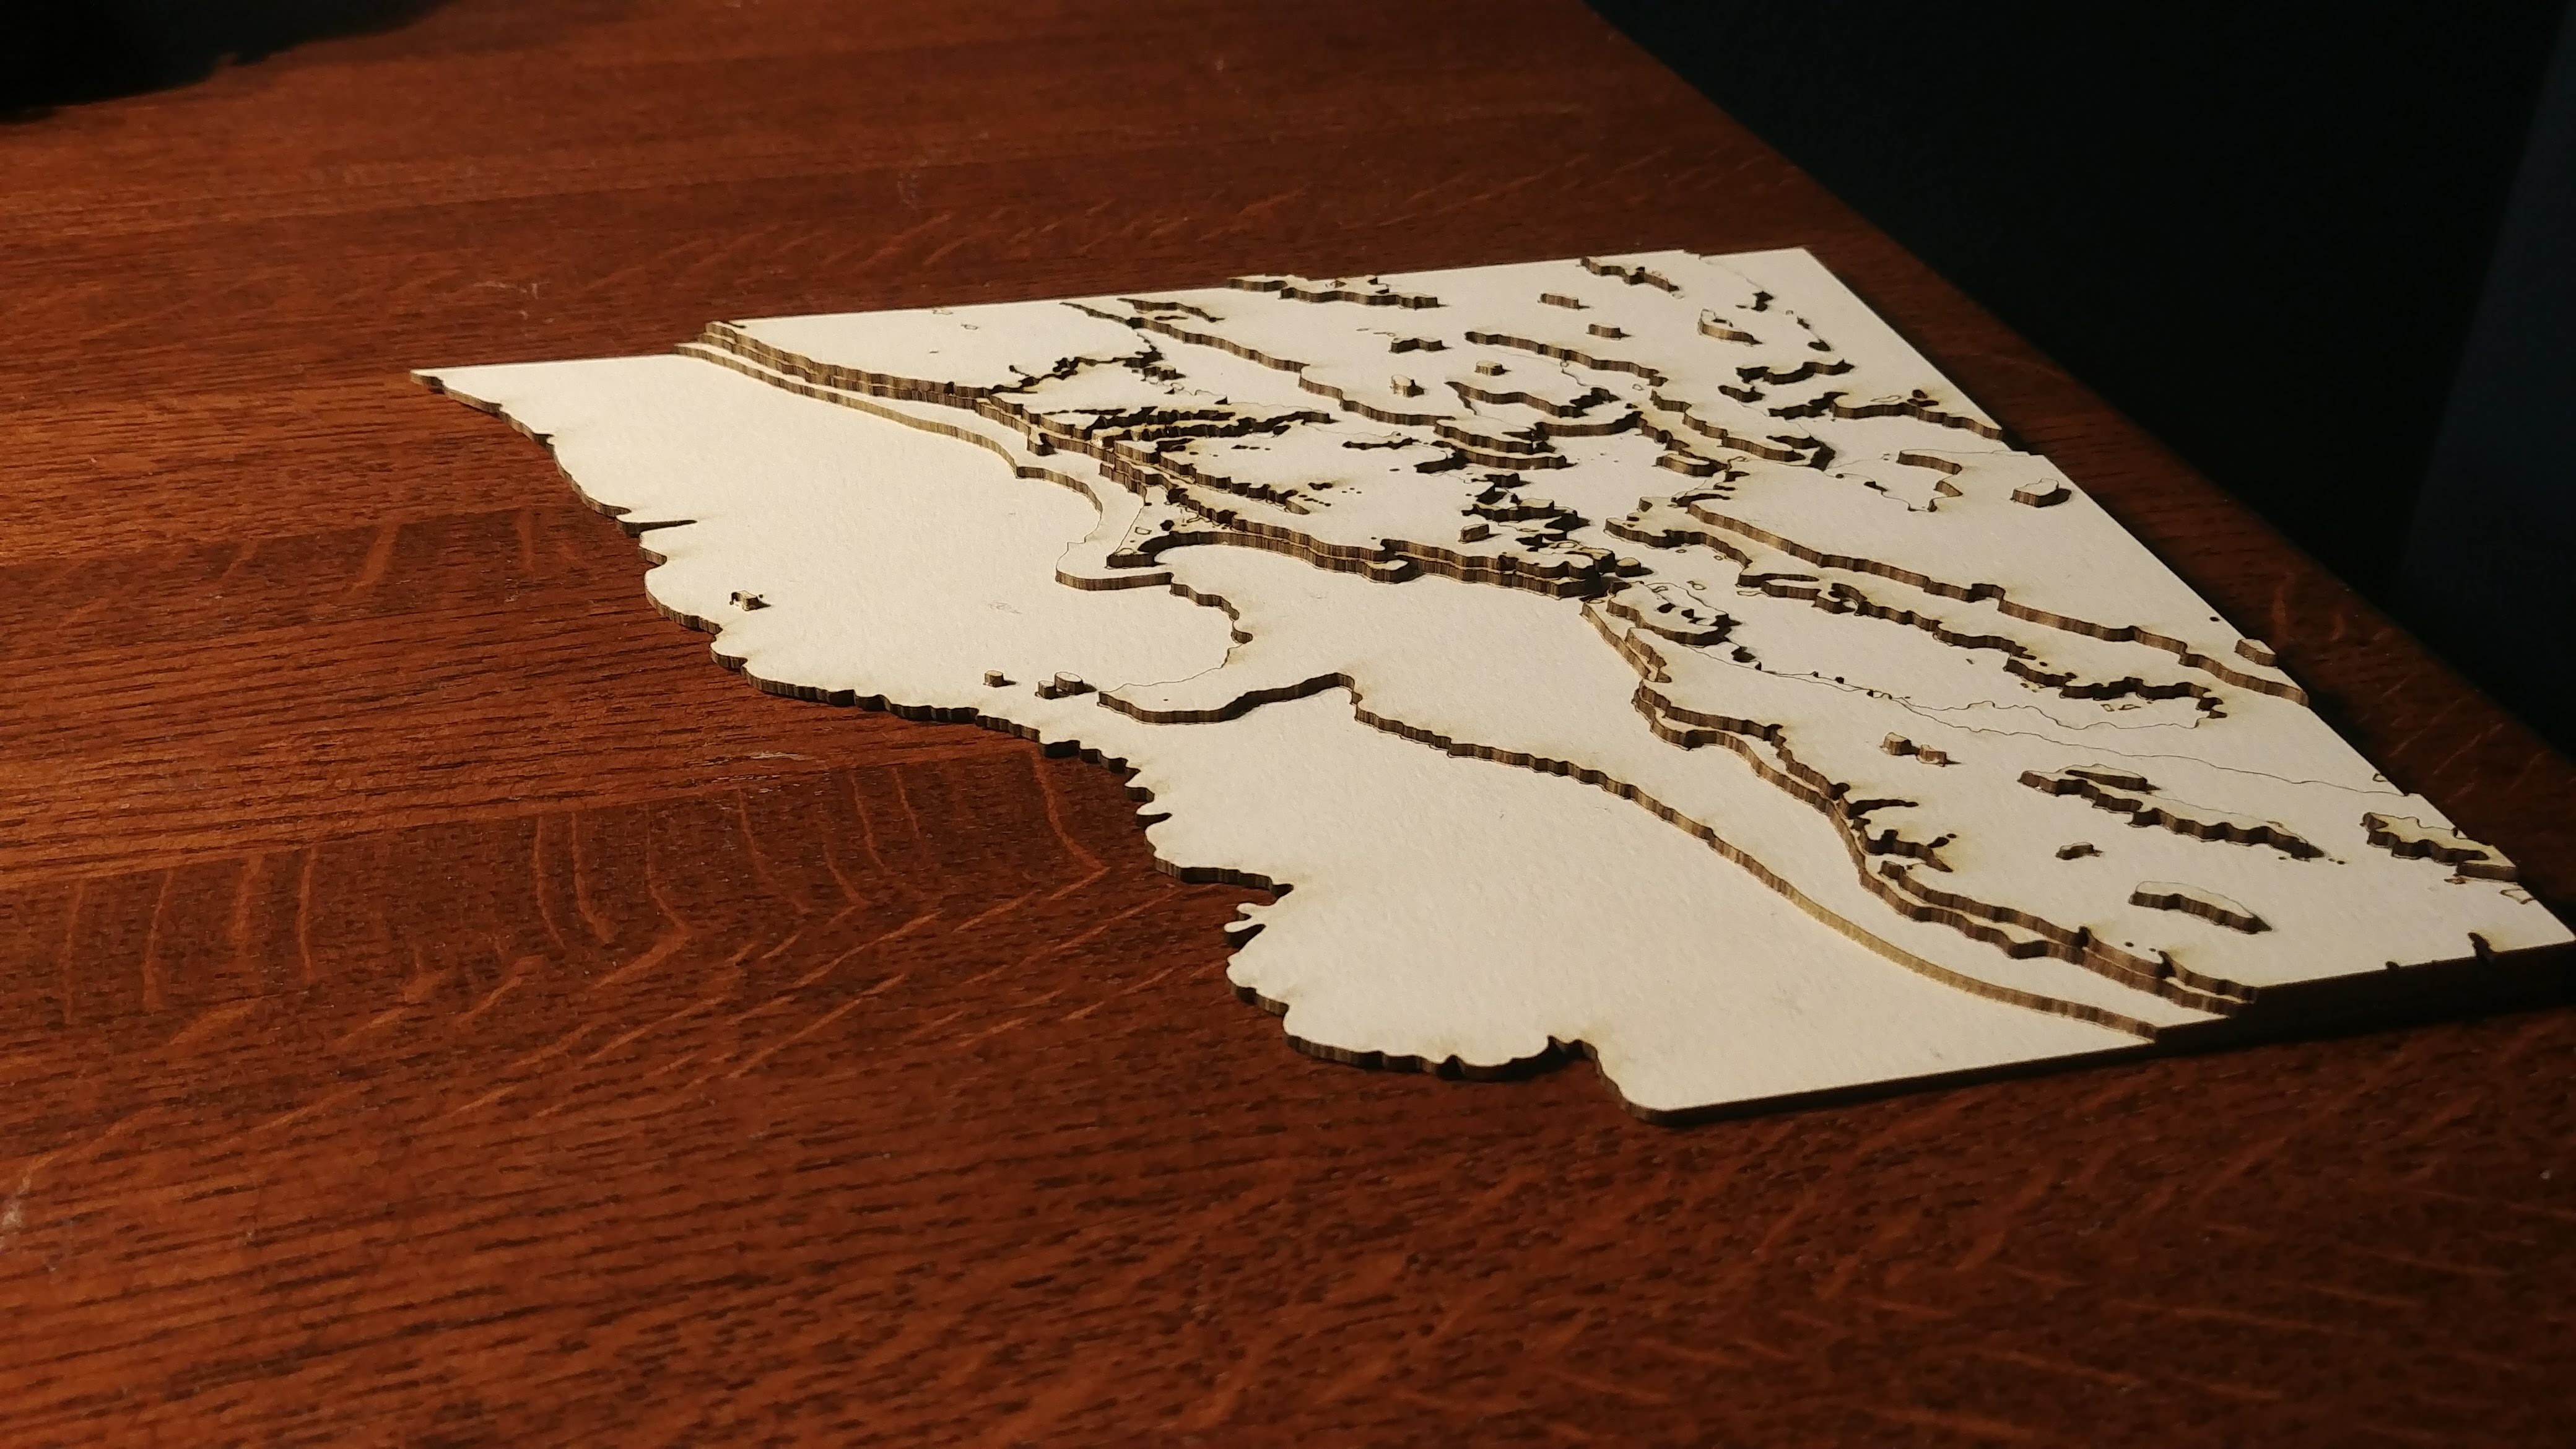
 After cutting out the layers, we glued them together:
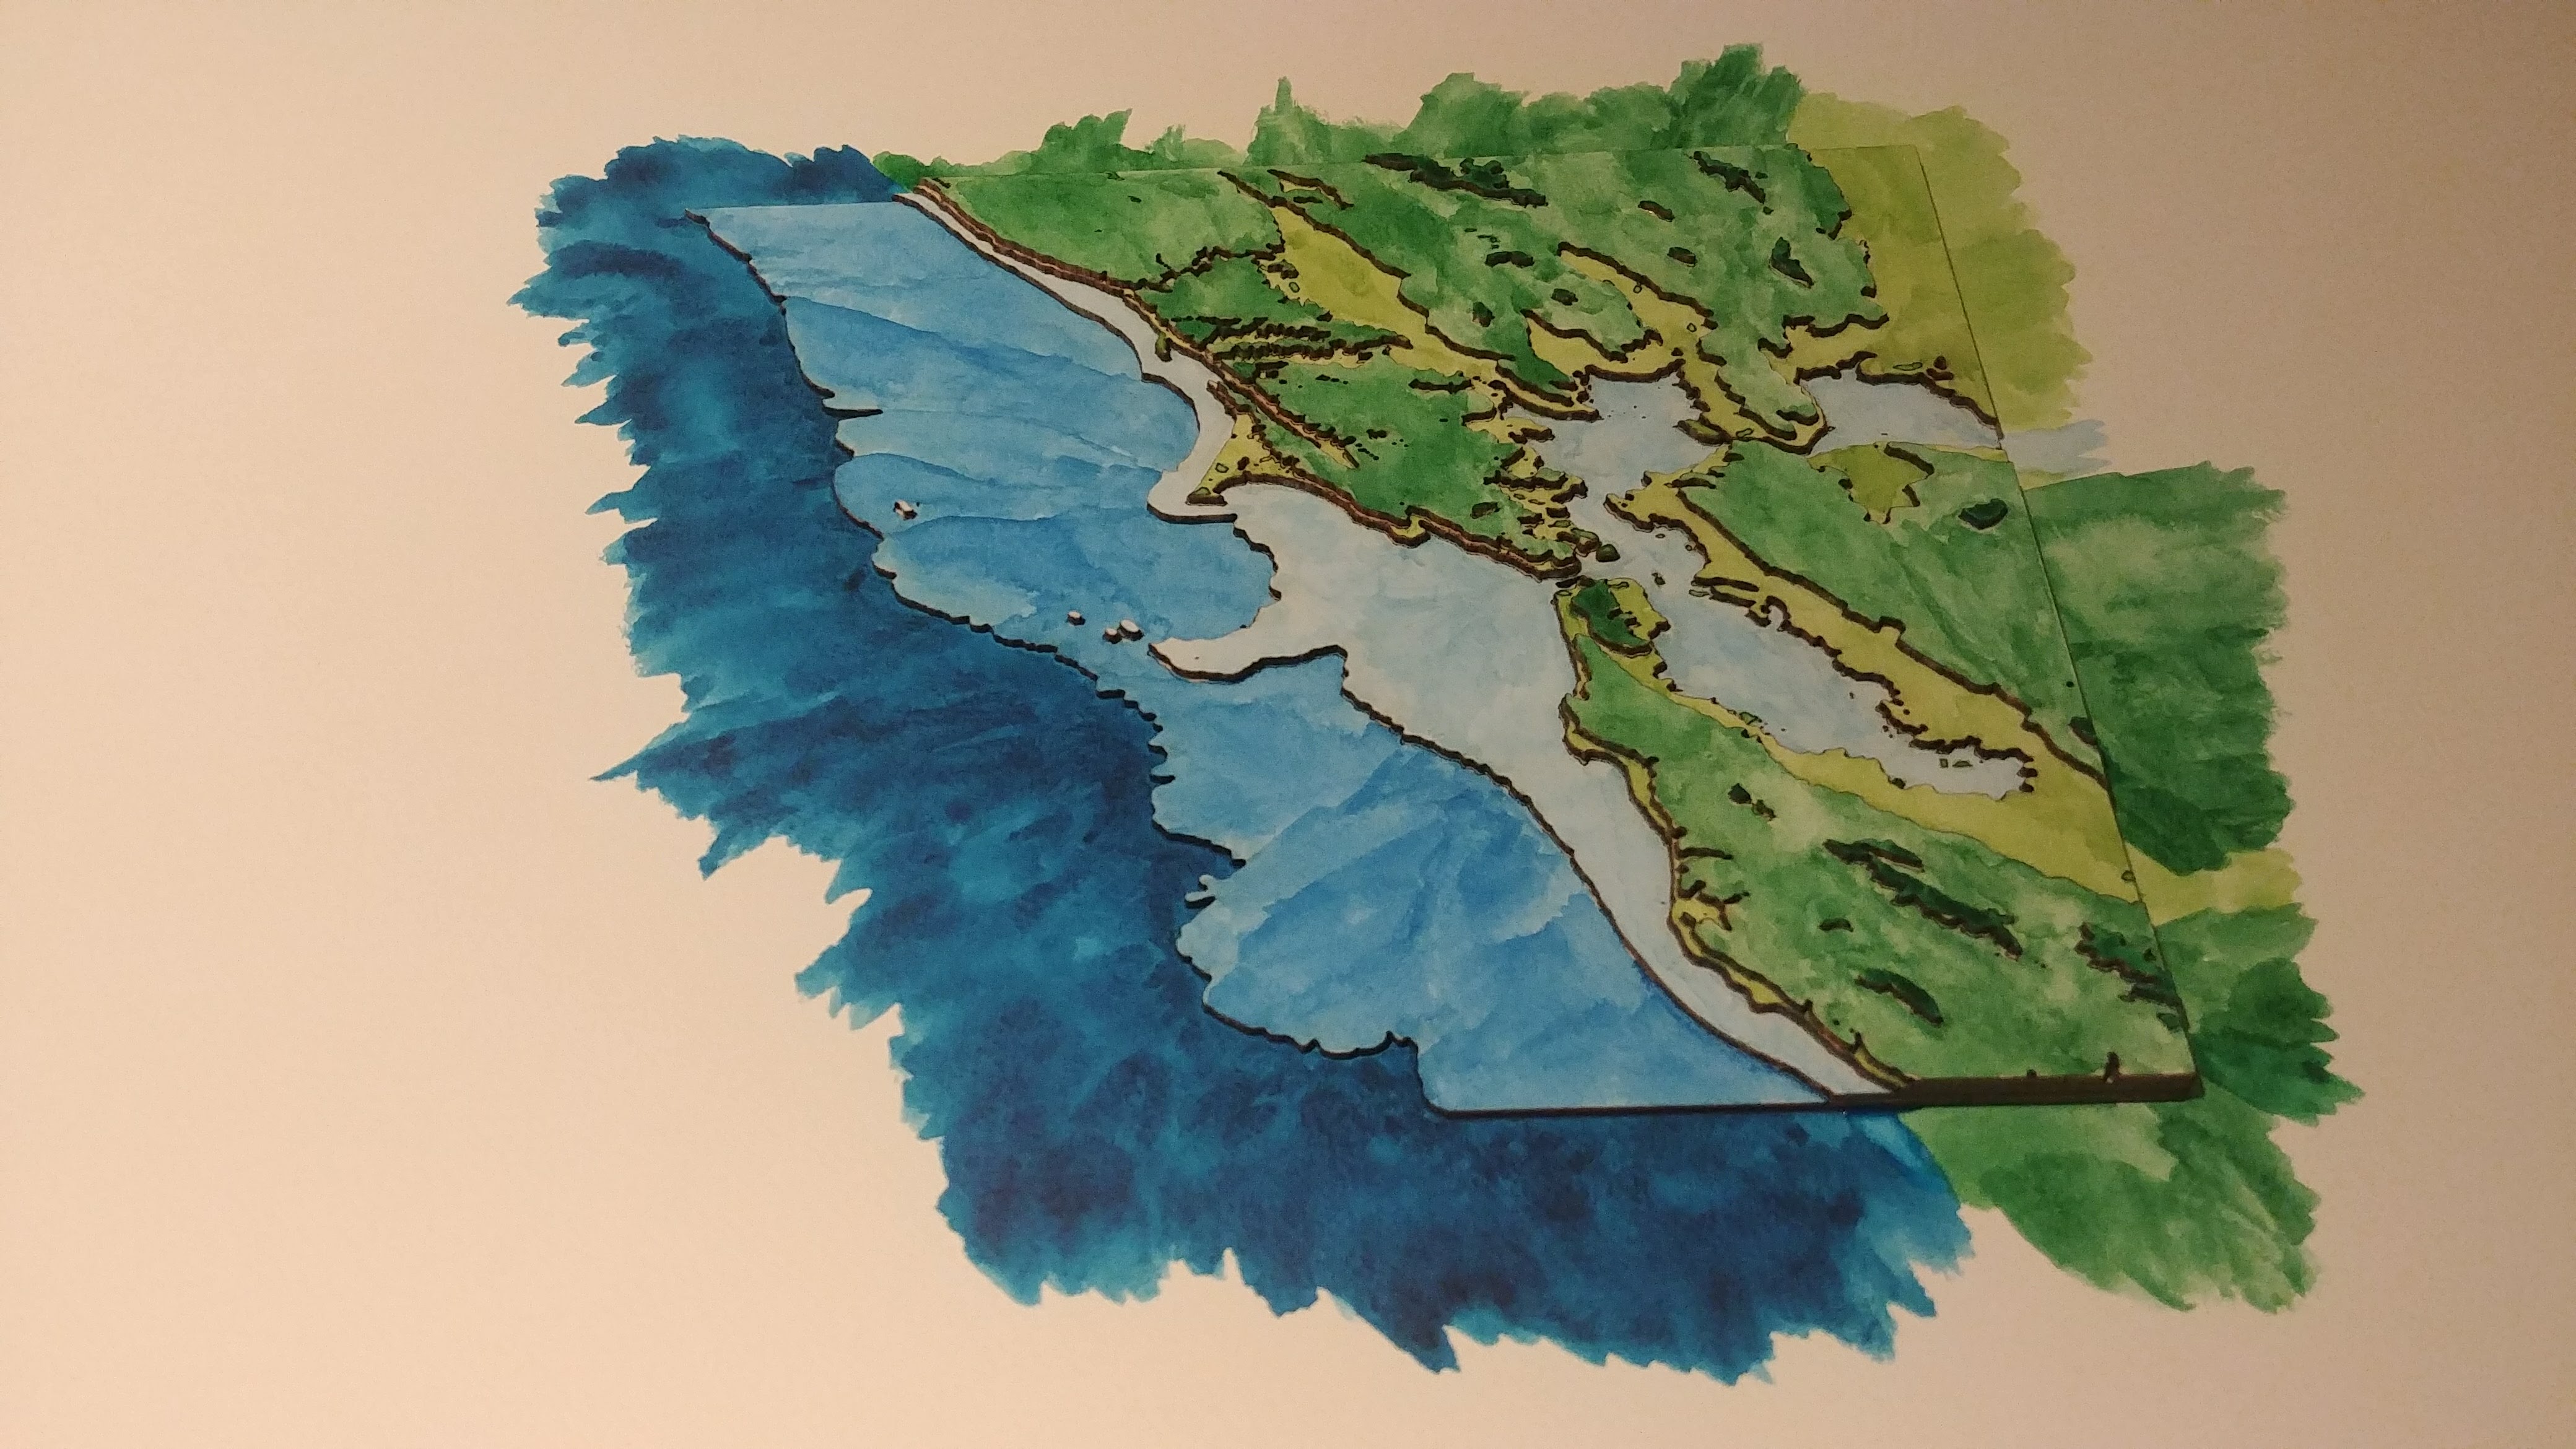
 I painted the final product using watercolors:
SFBayReliefModel uses data published by https://maps.ngdc.noaa.gov.